Quick profiling with Blackfire.io and DDEV
Imagine, one day, after few hours of implementing a new feature, you need one last test before pushing your code… The output sounds correct but… The page takes more than a minute to load!
No big deal! This is probably an internal network issue as usual. Let’s push to staging… Loading … Still loading… Gateway timeout! 😱
Choosing a profiler
Working with PHP, I had to pick one of:
- Tideways: Has a free & opensource version.
- Blackfire.io: Has a limited free plan.
I went with blackfire.io because A) it has better integration with DDEV and B) a better Timeline & Graph views UI.
Setup the profiler
Create a profile on Blackfire.io
First, you have to log in to Blackfire.io and create an organization and an environment.


DDEV integration
1- Add Blackfire.io service as DDEV additional service
$ cd .ddev$ curl https://raw.githubusercontent.com/drud/ddev-contrib/master/docker-compose-services/blackfire/docker-compose.blackfire.yaml > docker-compose.blackfire.yaml
2- Edit docker-compose.blackfire.yaml and replace YOUR_SERVER_ID and YOUR_SERVER_TOKEN with values from Fig 02
3- Add custom PHP configuration. This will ensure that the probe and agent can communicate.
$ mkdir php && curl https://raw.githubusercontent.com/drud/ddev-contrib/master/docker-compose-services/blackfire/php/blackfire.ini > php/blackfire.ini4- Restart DDEV
$ ddev restart5- Install Blackfire.io browser extension
And we are done!
Demo
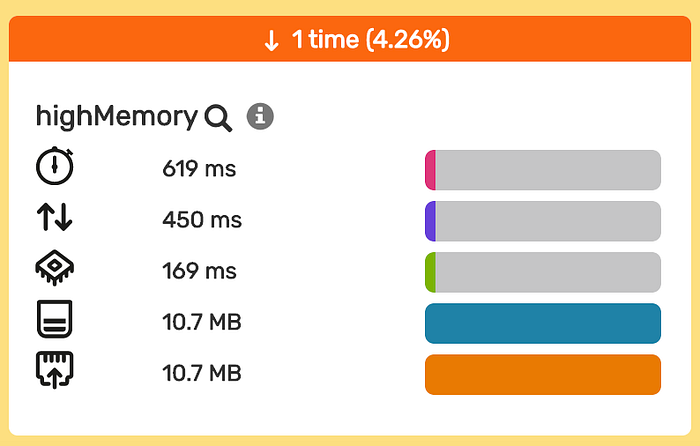
For the sake of the demo, I wrote a simple script that simulates slow execution time and high memory/CPU usage. You can find the code used for the demo on Github.
Profiling results
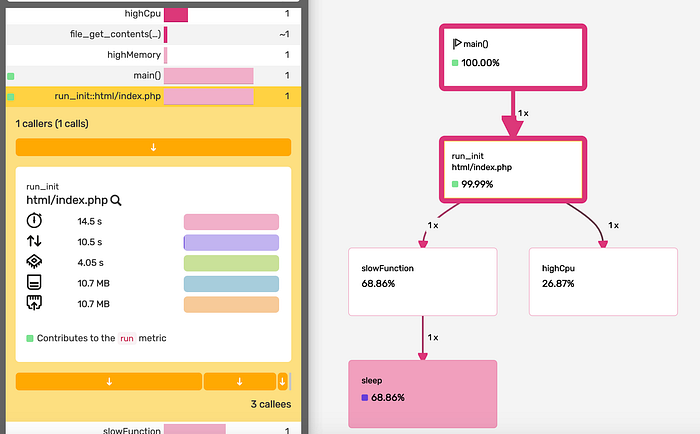
We can clearly see that the total execution time is 14.5s spent as follow:
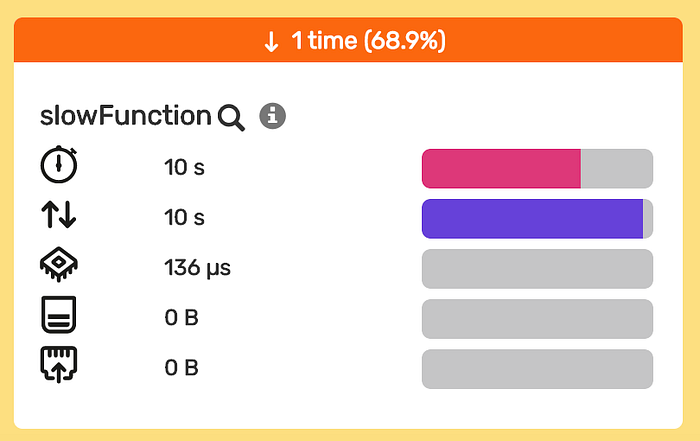
- slowFunction: 68.86% of the execution time.
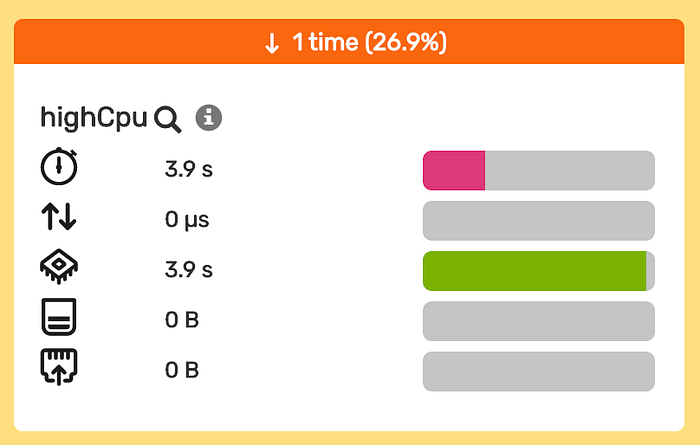
- highCpu: 26,87% of the execution tile.
If we go deeper inside function calls, we can see that it reflects exactly what happened inside the script.
Conclusion
Thanks to DDEV and Blackfire.io you can easily set up a profiler, analyze your code execution, and fix performance issues.
For further reading, you can visit the links below.
